Navigating Complexity with Color: The Power of Colorful Strategy and Logistics Concepts
In the world of business, information is abundant, but clarity is scarce. Reports overflow with data, workflows intertwine, and strategic plans can feel like labyrinths of abstract goals. This is where the concept of Colorful Strategy and Logistics emerges as a transformative visual language. Far more than a simple design choice, it is a methodology for using color as a functional tool to organize, communicate, and execute. By assigning specific meanings and roles to different colors, complex systems become intuitive, processes become transparent, and strategies become actionable.
The Foundation: What Are Colorful Strategy and Logistics Concepts?
At its core, this concept is about applying a consistent, semantic color system to business elements. It's a visual coding system. In a strategic context, colors are used to categorize objectives, denote priority levels, or differentiate between departments and initiatives. For example, blue might represent long-term vision, red immediate action items, and green growth metrics. In logistics and workflow, colors can map the journey of a process: yellow for "in review," orange for "in progress," and purple for "completed."
The purpose is to reduce cognitive load. Our brains naturally associate and remember colors. A well-designed color system allows a team to instantly grasp the status of a project from a single slide or understand the focus of a financial report from its chart legends, without needing to decipher dense text or numbers first. It turns abstract information into a visual landscape that is easier to navigate.
From Presentation Slides to Brochures: The Practical Applications
This methodology shines in everyday business design elements, particularly in templates for presentations, reports, and marketing materials.
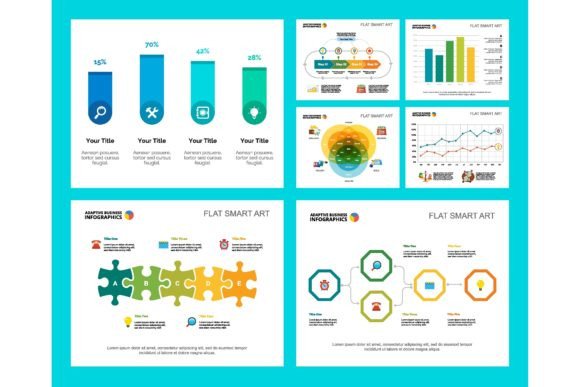
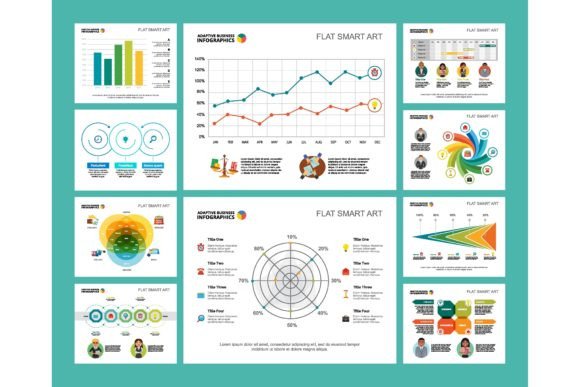
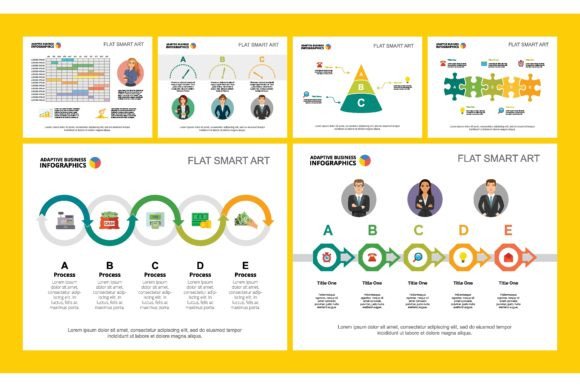
- Financial Reports: A colorful bar chart isn't just aesthetically pleasing. If revenue streams are always coded blue, operational costs orange, and profit green, stakeholders can track performance across quarters instantly, building a visual narrative of financial health.
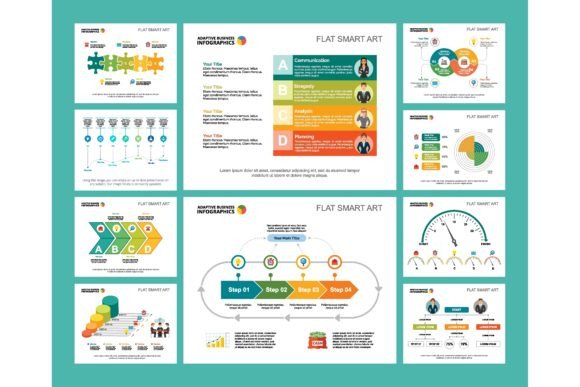
- Workflow Layouts: Process diagrams become intuitive maps. Each stage of a product development or client onboarding workflow has a dedicated color. This visual clarity helps teams identify bottlenecks (e.g., a cluster of "stalled" red stages) and understand their role in the broader sequence.
- Brochure Design: Even in marketing, color strategy organizes information for the reader. Different service offerings or product features can be presented in distinct color blocks, making the brochure's structure clear and helping potential customers self-guide through the information.
The key is consistency. The color system must be defined and adhered to across all materials to build a strong, reusable visual vocabulary for the organization.
Why Color Matters: The Psychological and Functional Significance
Color psychology plays a supporting role, but the primary significance here is functional. While we might loosely associate red with urgency or blue with trust, the assigned meaning within a business system is what truly matters. This moves color from being merely decorative to being an integral part of the information architecture.
Its significance lies in:
- Universal Comprehension: It creates a common language that transcends departmental jargon. An engineer, a salesperson, and an accountant can all look at the same strategic infographic and understand the current priorities.
- Error Reduction: Visual differentiation reduces mistakes. In a logistics dashboard, a shipment coded yellow ("awaiting customs") is less likely to be mistaken for one coded purple ("delivered") than if both were listed in plain text.
- Enhanced Engagement: Colorful, well-organized information is more engaging and memorable. This increases the likelihood that a strategy will be internalized by a team or that a report's insights will be acted upon.
Fitting into Modern Business and Technology
In our data-driven age, this concept fits perfectly. Digital tools like project management software (e.g., Asana, Trello) and data visualization platforms (e.g., Tableau) often use color tagging and coding as a fundamental feature. Businesses are extending this principle to their offline materials to create a seamless visual experience. Furthermore, it supports remote and hybrid work. A shared color-coded strategy deck ensures everyone, regardless of location, is interpreting the information the same way.
It also bridges the gap between creativity and analytics. It allows for the design-thinking principle of clarity to be applied to traditionally numeric or text-heavy fields, making business intelligence more accessible and human-centric.
Building Your Color System: A Step-by-Step Approach
Implementing a colorful strategy isn't about picking favorite colors. It requires deliberate planning.
First, define your categories. What are the core elements you need to distinguish? For a strategy: Goals, Risks, KPIs, Departments. For a logistics workflow: Stages, Statuses, Responsible Teams, Resource Types.
Second, assign your colors. Aim for high contrast and clarity. Avoid subtle shades that might be hard to differentiate. Use a limited palette—often 6-8 distinct colors is sufficient. Document this "color key" as a master reference for all template creators.
Third, apply consistently across templates. Your presentation slide template should use the same red for "critical issue" as your financial report uses for "budget deficit." This builds institutional memory.
Examples in Action
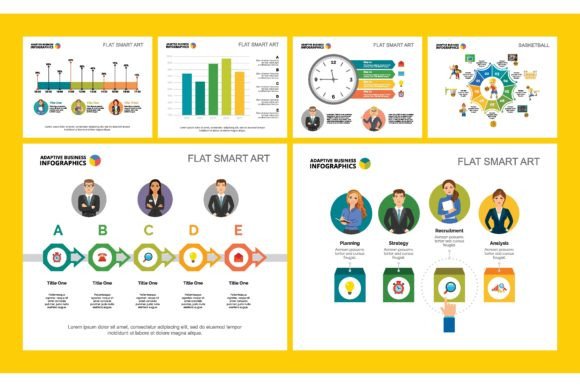
Imagine a company launching a new product. Their strategic infographic could use:
- Green Tiles: Market Opportunity & Growth Goals
- Blue Tiles: Research & Development Phases
- Orange Tiles: Marketing & Launch Activities
- Red Borders: Highlighted Key Milestones
This allows leadership to see, at a glance, that the plan balances growth (green), groundwork (blue), and action (orange).
For a logistics example, a supply chain dashboard might show:
- Purple Lines: Finished Goods Transport
- Yellow Lines: Raw Material Transport
- Solid Shapes: Warehouse Nodes
- Striped Shapes: Manufacturing Nodes
A disruption in the yellow raw material line immediately draws attention to a potential upstream problem.
Clarifying Common Misunderstandings
It's important to address some assumptions about this concept.
Misunderstanding 1: It's Just "Making Things Pretty." This is the most common error. The primary goal is not aesthetics but function and communication. The beauty is a beneficial side effect of a clear system.
Misunderstanding 2: You Must Follow Standard Color Psychology. While cultural associations can be considered, your internal definitions are paramount. If your company decides that pink represents "high-profit margin," that's the valid meaning within your ecosystem.
Misunderstanding 3: It Adds Unnecessary Complexity. On the contrary, it simplifies. The initial effort to define the system pays off manifold in saved time and reduced confusion every time the templates are used. It's an investment in clarity.
The Broader Impact: Building a Visual Language for Your Organization
Adopting Colorful Strategy and Logistics concepts is more than a design project; it's a step towards building a cohesive visual language. This language becomes part of the company's culture, streamlining communication from the boardroom to the front line.
It empowers everyone. Beginners and new hires can grasp complex structures faster because the visual code guides them. Experienced professionals gain a more efficient tool for analyzing data and orchestrating processes. In education and training, these colorful templates can make learning organizational procedures or business models much more effective.
Ultimately, in a world saturated with information, the ability to organize and present that information with intuitive clarity is a competitive advantage. Colorful Strategy and Logistics provides a simple yet powerful framework to achieve just that, turning chaos into a coherent, navigable, and actionable map.