Beyond Gray Boxes: Why Your Strategy Needs Color
In a world of business presentations dominated by sterile templates and monochrome charts, a Colorful Workflow or Strategy Concept is more than just a design choice—it’s a cognitive and communicative strategy. This approach leverages vibrant, structured infographic charts and elements not merely for decoration, but as a functional system to guide understanding, emphasize hierarchy, and make complex information intuitively accessible.
The Visual Language of a Colorful Strategy
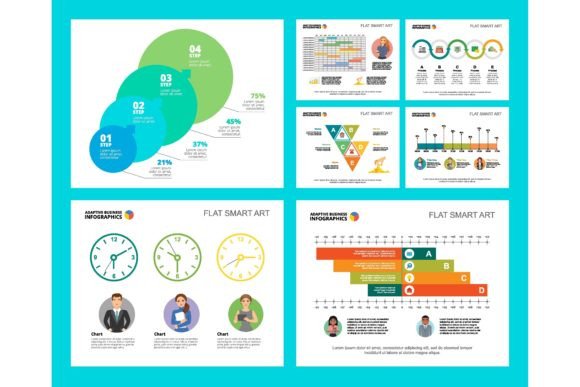
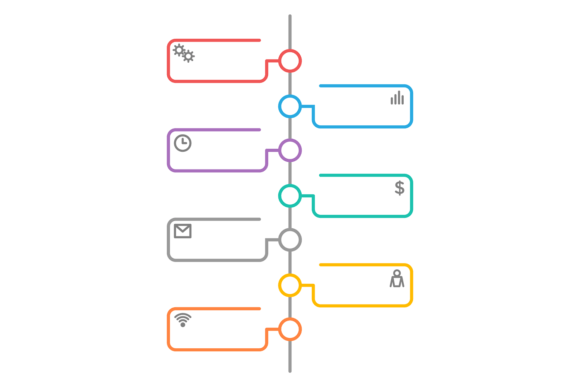
Imagine a financial report where revenue streams are not just labeled, but visually coded with distinct, harmonious colors. Or a workflow layout where each stage transitions through a gradient, signaling progress naturally. This is the core of the Colorful Workflow or Strategy Concept. Its visual characteristics are defined by purposeful chromatic palettes, clean geometric shapes, and a balanced mix of data density and visual relief. The personality is energetic yet organized, confident yet approachable. It avoids the chaos of random color splashes, instead employing color with discipline—to categorize, to connect, to highlight.
The overall appeal lies in its ability to bridge the gap between analytical rigor and human engagement. A gray flowchart is a technical document; a color-coded one becomes a story. This style speaks to an audience’s need for clarity without oversimplification, offering a premium feel that elevates standard reports, slide decks, and brochure designs from mere documents to compelling narratives.
Where Color-Driven Design Works Best
The applications for this design philosophy are vast, crossing seamlessly from digital to print and from personal projects to commercial campaigns.
For entrepreneurs and small business owners, these elements can transform a startup pitch deck. Using a set of cohesive, colorful charts to present a market analysis or a five-year financial projection makes the data more memorable and the business vision more tangible.
Marketers and content creators can leverage these assets in social media graphics to explain a multi-step campaign or in blog articles to break down a complex process. A well-designed infographic set acts as a magnet for engagement, often outperforming text-heavy posts.
In branding and publishing, a consistent use of a colored strategy system across different media—from a printed annual report to a website’s “Our Process” page—builds a powerful, cohesive brand identity. It signals a modern, thoughtful organization that cares about how its message is received.
Even for designers and crafters working on personal projects or client work, these template elements provide a sophisticated foundation. They offer a starting point that ensures visual harmony, allowing the creator to focus on content rather than wrestling with basic chart design.
Real-World Impact: Readability, Perception, and Engagement
Adopting a Colorful Workflow or Strategy Concept directly influences key outcomes. First, it enhances readability and visual hierarchy. Our brains process color-coded information faster than plain text or uniform symbols. A critical step in a process in bright orange immediately draws the eye, establishing priority without a bold font or a giant arrow.
Second, it shapes brand perception. Consistency in using a specific, thoughtful color scheme across all presentations and documents breeds professionalism. It shows attention to detail and a commitment to quality. Over time, this visual consistency aids in brand recognition—your audience begins to associate that specific look and feel with your company’s voice.
Finally, it drives audience engagement. People are more likely to read, understand, and remember a colorful, well-structured document. In a brochure design, for instance, a vibrant workflow layout explaining your service can convert a casual reader into a interested prospect much more effectively than a paragraph of text.
A Practical Guide to Implementing Colorful Design Elements
Moving from standard templates to a color-centric strategy requires a bit of planning. Here’s how to approach it practically.
Start by Evaluating Project Fit: Not every document needs a full spectrum. A dense, legalistic contract might not be the place. But any project aiming to explain, persuade, or summarize—financial summaries, product launch timelines, instructional guides—is a prime candidate. Ask: “Is my goal to make this information easier to digest and more compelling?” If yes, color can be a powerful tool.
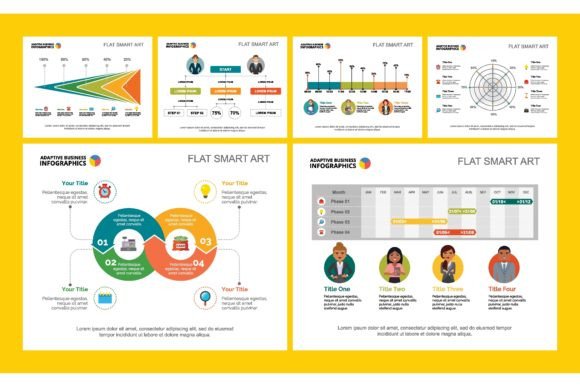
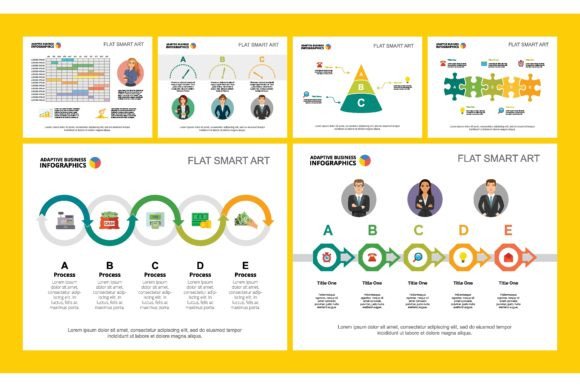
Test for Cohesion and Pairing: The provided infographic charts sets are designed as cohesive families. Use them as a system. Don’t introduce unrelated chart styles or clashing color palettes from another source. If you are incorporating text, choose a complementary sans serif font for body text—something clean and modern that doesn’t compete with the visual elements. The design assets should work in harmony.
Review Included Styles and Variations: A good set will offer variations—perhaps a circular progress chart, a linear flowchart, and a bar chart module, all using the same color codes. Explore these. Using different styles for different data types within the same document keeps the reader engaged while maintaining brand consistency.
Prioritize Readability Above All: Color is a tool for clarity, not obscurity. Ensure there is sufficient contrast between elements. Check that color legends are clear. Test your design on someone unfamiliar with the content. Can they follow the story? The ultimate test of a Colorful Workflow or Strategy Concept is whether it makes things simpler, not more complicated.
Understand Licensing for Commercial Use: If you are using a purchased template or font set for client work or within your company’s commercial materials, always verify the license. Most premium sets for presentation slide templates allow broad commercial use, but confirming this avoids future issues and respects the creator’s work.
From Slides to Success: An Observational Example
Consider a common scenario: a small business presenting its expansion strategy to potential investors. Slide after slide of bullet points and black-and-white market graphs creates a passive experience. Now, re-imagine that presentation using a Colorful Workflow or Strategy Concept.
The market analysis uses a multi-colored segmented ring chart, each competitor a distinct hue. The expansion timeline is a gradient flowchart, moving from cool blues for planning phases to warm greens for execution and gold for launch. The financial projection is not a table, but a set of ascending, color-blocked bars. The result? The presentation is not just heard; it’s visually experienced. The data sticks. The story of growth is not just told; it’s illustrated. This is the power of moving beyond gray boxes—it’s the power of making your strategy not only smart, but also seen and remembered.
In the end, whether you’re a designer crafting a brand identity, a blogger explaining a complex hobby technique, or a manager preparing a quarterly review, integrating a thoughtful, colorful design system is a step toward more effective communication. It’s an investment in how your ideas are perceived, understood, and acted upon.